MS Release Management - 3 troubleshooting tricks

Lately, I’ve had my fair share of troubles getting the Deployment Agent working properly, and I found that the following tricks have helped me enormously in pinpointing their causes.
1. Enable HTTP communication on the RM services
Especially if you’re working with shadow accounts and/or disjoint domains, it might not always be clear if the Deployment Agent can reach the Release Management server and/or if the credentials you’re using are actually being recognized by the Release Management server.
A good way to test the connectivity is to call a Release Management service directly from a web browser. By default, the Release Management services only accept SOAP communication and will not respond to browser requests, but you can temporarily enable this by modifying the service’s web.config (usually located at C:Program Files (x86)Microsoft Visual Studio 12.0Release Managementservices).
To enable HTTP requests, comment out the remove elements from the system.web/webServices/protocols section as follows:
<webServices>
<protocols>
<!--<remove name="Documentation" />
<remove name="HttpGet" />
<remove name="HttpPost" />
<remove name="HttpPostLocalhost" />-->
<add name="AnyHttpSoap" />
</protocols>
</webServices>
</system.web>
You should now be able to access the Release Management services with a browser, e.g. by navigating to http://<servername>:1000/ConfigurationService.asmx. The services all use Windows authentication and only accept authenticated users, so if the server can be reached you’ll be presented with a login box. Enter the Deployment Agent’s service account credentials here to see if they are accepted by the Release Management services.
2. Enable verbose logging on the Deployment Agent
Sometimes, it can be quite hard to figure out what goes wrong in the Deployment Agent, be it in either configuring the Deployment Agent correctly or deploying a release package with it. Luckily, the Deployment Agent is capable of logging what goes on under water, and these logging settings can be altered to log more detailed information.
By default the Deployment Agent is installed in C:Program Files (x86)Microsoft Visual Studio 12.0Release Managementbin. If you open the DeploymentAgent.exe.config file here, you’ll find the following fragment (my changes are marked):
<loggingConfiguration name="Logging Application Block" tracingEnabled="true"
defaultCategory="General" logWarningsWhenNoCategoriesMatch="true">
<listeners>
<!-- ... -->
<add name="Rolling Flat File Trace Listener"
formatter="Single Line Text Formatter"
traceOutputOptions="None"
filter="Verbose"
fileName="C:LogsDeploymentAgent.log"
rollSizeKB="5000"
rollFileExistsBehavior="Increment" .. />
During development, I recommend changing the filter level to Verbose so you can keep tabs on what the Deployment Agent is doing exactly. This is especially helpful when determining from where and how your components are being deployed (or rather, not being deployed) – the Release results window only tells you so much.
Also, I always seem to forget where the log file is written to, so I’ve also changed the location to something I can remember.
See this blog article for a full explanation of how to enable logging on the other RM components.
3. Enable network tracing on the Deployment Agent
Not everything that happens between the Deployment Agent and the Release Management server gets logged in the Deployment Agent’s logs, and sometimes it can be enlightening to see what goes on between these two on a network level.
In fact, I found that sometimes it’s the only way to capture the stack trace of an Exception that occurs on the server side.
As described here , the .NET framework has built-in tracesources for things that happen on a network level (but for many other purposes as well), and we can get this tracing information by adding the following fragment to the Deployment Agent’s config file (C:Program Files (x86)Microsoft Visual Studio 12.0Release ManagementbinDeploymentAgent.exe.config):
<system.diagnostics>
<sources>
<source name="System.Net.Sockets" maxdatasize="10240">
<listeners>
<add name="socketListener"/>
</listeners>
</source>
</sources>
<switches>
<add name="System.Net.Sockets" value="Verbose"/>
</switches>
<sharedListeners>
<add name="socketListener" type="System.Diagnostics.TextWriterTraceListener"
initializeData="C:Logsnetwork.log" />
</sharedListeners>
<trace autoflush="true"/>
</system.diagnostics>
</configuration>
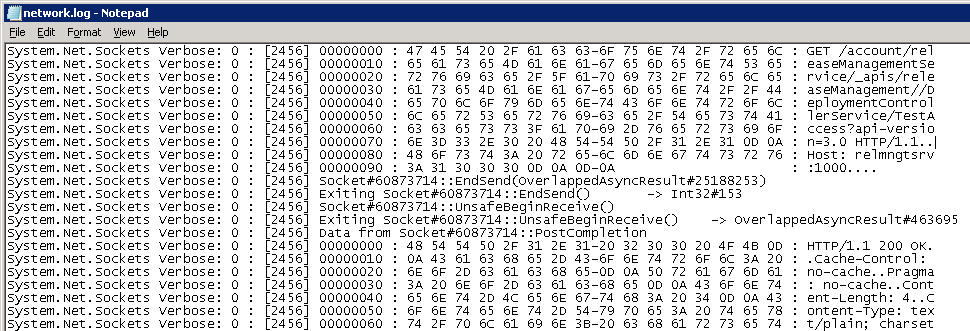
Restart the Microsoft Deployment Agent service to have these settings take effect – you’ll immediately see the logfile fill up with data such as this:
 This way, you can see the HTTP request/response messages that are being exchanged between agent and server.
As always, don’t forget to turn these settings off when you’re done troubleshooting.